Forget everything you think you know about taking notes. Graphic note taking isn't about creating a masterpiece; it's the simple but incredibly effective practice of translating what you hear into a visual language of text, symbols, and shapes. It’s less about being an artist and more about becoming a visual thinker, creating mental maps that make it far easier to recall details and see the connections between ideas.
So, What Is Graphic Note Taking Anyway?
Think about trying to describe a spiral staircase using only words. You could probably do it, but wouldn't a quick sketch get the point across instantly? That's the core idea behind graphic note taking. It frees you from the rigid, linear format of traditional, text-only notes.
Instead of just writing down every word someone says, you're actively processing the information. You listen for the big ideas, grab them with keywords, and then link them together using simple drawings, arrows, and other visual cues. This approach engages multiple parts of your brain at once, blending the logical side that processes language with the creative, pattern-spotting power of visual thinking. What you're left with isn't just a page of notes—it’s a map of your understanding.
It's More Than Just Doodling
It's a common misconception to see graphic note taking as aimless doodling, but it’s actually a very structured and intentional process. Every symbol, color, and how you arrange things on the page adds another layer of meaning. The real goal is to build a clear visual hierarchy where the most important concepts practically jump off the page.
You're working with a few key building blocks:
- Keywords: Short, potent words or phrases that nail the essence of a topic.
- Containers: Shapes like boxes, clouds, or circles to group related ideas together.
- Connectors: Arrows and lines that show the flow and relationship between different concepts.
- Simple Icons: Basic drawings that stand in for common ideas, like a lightbulb for a new idea or a heart for something you value.
Think of it as creating an infographic in real-time. You're not just recording information—you're organizing, synthesizing, and structuring it in a way that makes complex topics easier to digest and remember.
A Method with Deep Roots
While it might feel like a new trend, using visuals to share information is as old as time. The broader field of data visualization really took off in the 19th century, a period often called the "Golden Age of statistical graphics." Between 1850 and 1900, governments and statisticians started using maps and charts to make sense of complex data for the public.
Today, tools like TNote carry on this legacy, helping people turn simple text into engaging visual knowledge cards. Graphic note taking is simply the personal, hand-crafted version of this powerful communication principle, putting that same power right at your fingertips.
Why Visual Notes Supercharge Your Brain
Have you ever noticed how a single image can tell an entire story? Our brains are wired to process visual information incredibly quickly. That simple but powerful principle is the secret behind why graphic note taking is so much more effective than just writing words. It’s a method that works with your brain's natural preferences, not against them.
This phenomenon has a name: the Picture Superiority Effect. At its core, it just means we are far more likely to remember ideas when we see them as pictures instead of just words. When you draw a simple image next to a key phrase, you're giving your brain two separate hooks to hang that memory on. This creates a much stronger, more lasting connection to the information.
Think of it this way. Traditional, linear notes are like having a big pile of identical red LEGO bricks. You can stack them up, sure, but it’s tough to distinguish one part of your wall from another. Graphic note taking gives you bricks of all shapes, sizes, and colors, letting you build a rich, detailed, and truly memorable structure.
From Passive Scribe to Active Thinker
One of the most profound shifts you'll experience when you start taking visual notes is moving from passively writing things down to actively making sense of them. When you’re trying to capture every single word in a lecture, you’re not really processing the information. You’re just a human photocopier. Your mind is so focused on transcribing that it's not actually thinking about the content.
Graphic note taking forces you to listen in a whole new way. You have to tune in, pick out the most important concepts, figure out how they relate to each other, and then decide on a simple way to draw them. This process of translating what you hear into a visual map demands a much deeper level of engagement. You're not just hearing the information—you're thinking with it in real time.
By organizing ideas visually as you learn, you build stronger neural pathways. This process doesn't just improve recall for a test; it enhances genuine comprehension and unlocks the ability to see the "big picture" that often remains hidden in pages of linear text.
Building a Better Memory Framework
The very structure of a visual note helps cement information in your memory. And it’s not just a feeling; the data backs it up. Research shows that structured graphic note taking can significantly boost information retention and test scores. In fact, studies have found that students who use guided notes with graphic organizers—like outlines and visual frameworks—demonstrate better accuracy and academic performance. For instance, learners using outline-based notes captured a more complete set of information than those using traditional, unstructured methods. You can dive deeper into these note-taking statistics to see the full impact.
This improvement happens for a couple of key reasons:
- Spatial Organization: When you place ideas on a page, your brain creates a mental map. You begin to remember that the main idea was in the center, a key detail was drawn in the top-right corner, and an opposing view was down at the bottom.
- Revealing Connections: Using simple arrows, lines, and containers makes the relationships between ideas crystal clear. This visual logic uncovers patterns and connections that are nearly impossible to spot in a wall of text.
Ultimately, graphic note taking turns learning from a chore into a creative act of discovery. You’re not just taking notes; you are creating knowledge.
The Core Elements Of Graphic Note Taking
So, you're ready to dive into graphic note taking. The biggest hurdle for most people is the thought, "But I can't draw!" Let's get that out of the way right now: you don't have to be an artist. This isn't about creating a masterpiece for a gallery; it's about clear communication.
Think of it as learning a new, simpler alphabet. Instead of 26 letters, your visual language is built from just a handful of basic shapes, lines, and text. By combining these simple building blocks, you can capture complex ideas in a way that’s incredibly fast and easy to recall later. The trick is to start with the basics and slowly develop your own visual shorthand.
Let's take a look at how this all comes together. When you strip away the fancy stuff, traditional notes and graphic notes have very different approaches and outcomes.
Here’s a quick breakdown:
Traditional Notes vs Graphic Notes
| Aspect | Traditional Note Taking | Graphic Note Taking |
|---|---|---|
| Process | Linear, top-to-bottom. Captures words verbatim. | Non-linear, spatial. Captures ideas and connections. |
| Cognitive Engagement | Primarily auditory and linguistic processing. | Engages multiple brain areas: spatial, visual, and linguistic. |
| Outcome | A text-based transcript. | A visual map of concepts. |
| Recall | Relies on reading and re-reading lines of text. | Memory is triggered by colors, shapes, and spatial layout. |
| Flexibility | Difficult to insert new ideas or show relationships retroactively. | Easy to add new points and draw connections anywhere on the page. |
As you can see, the shift is from passively transcribing information to actively constructing it. This active process is what makes graphic notes so powerful for both understanding and remembering.
Building Your Visual Vocabulary
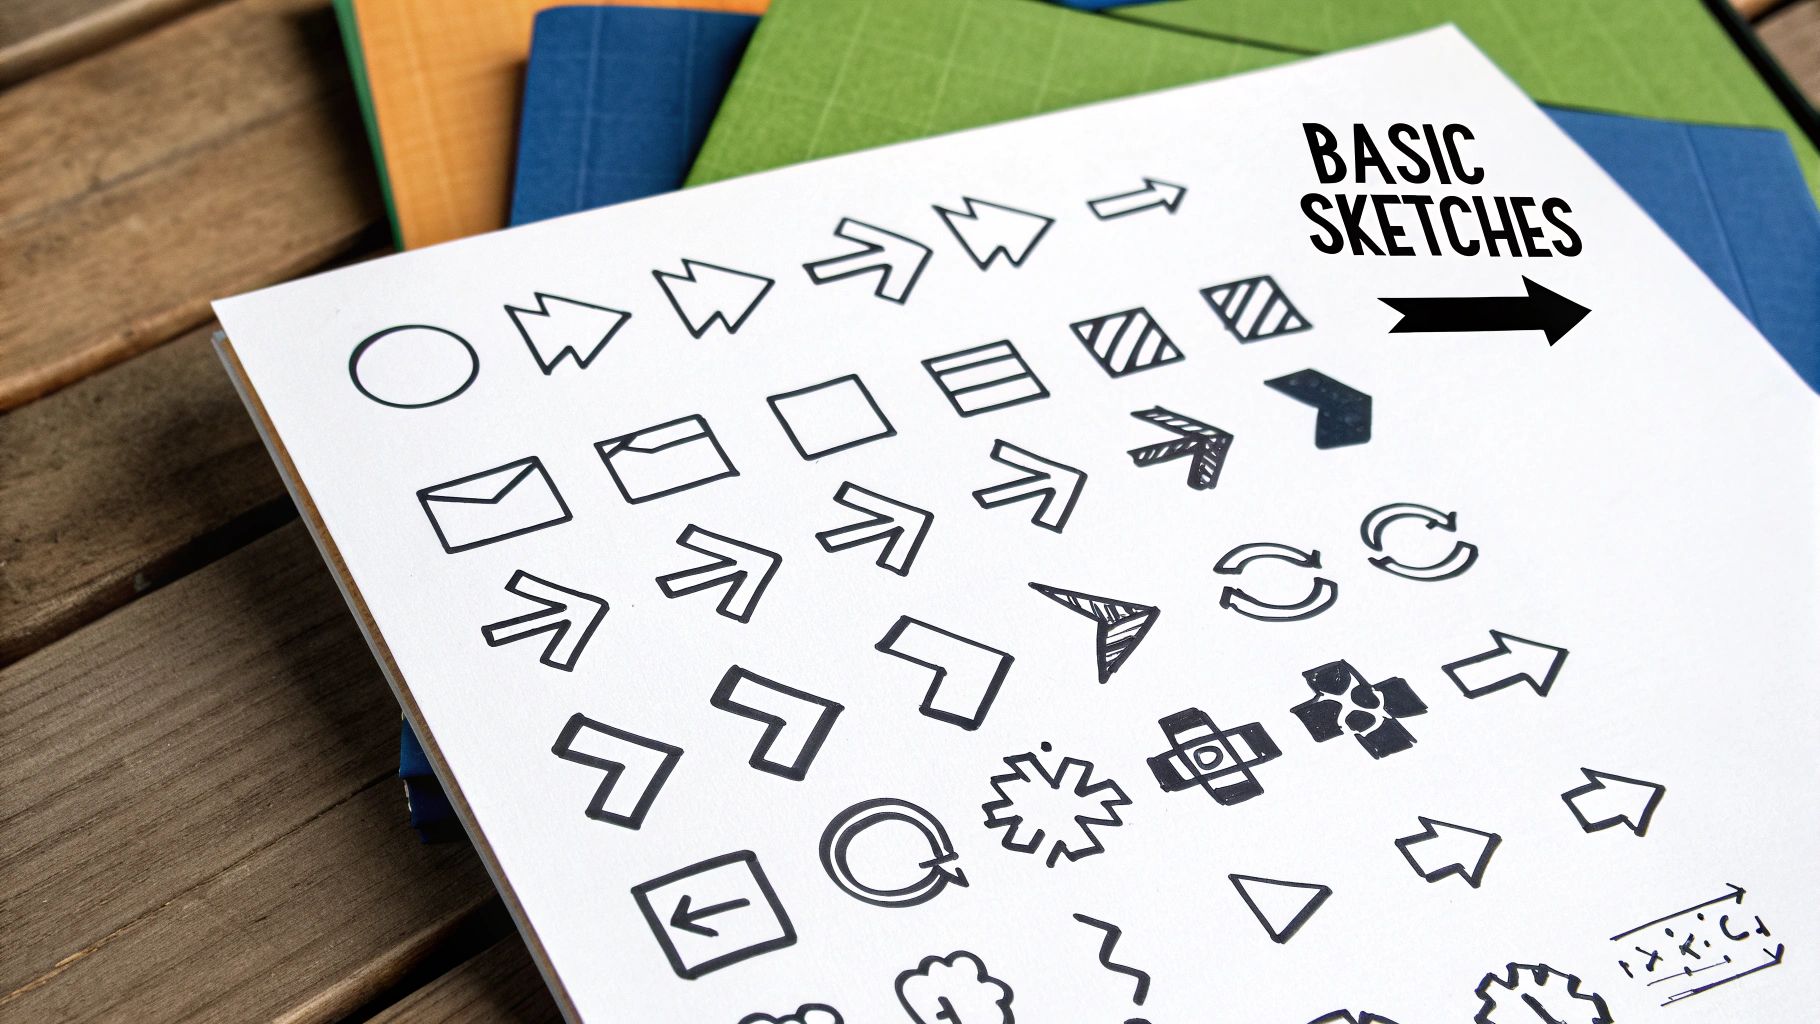
Your visual vocabulary is your personal stash of symbols and shapes that stand for common ideas. You really don't need a huge library to get started. In fact, a small, reliable toolkit is far more effective.
Here are the absolute essentials you'll be using constantly:
- Basic Shapes: Your workhorses are circles, squares, and triangles. You can assign meaning to them—maybe circles for people, squares for core concepts, and triangles for actions or goals. Keep it simple and consistent.
- Connectors: These are the unsung heroes. Simple lines and arrows are the glue that holds your notes together, showing relationships, flow, or cause-and-effect. A dotted line might show a tentative link, while a thick, bold arrow can scream, "This is important!"
- Containers: Think of these as visual buckets. Use larger shapes like clouds, boxes, or even just a simple border to group related ideas. If a presenter covers three key challenges, drawing a big container around them instantly bundles them into a single, cohesive unit.
The goal isn't artistic perfection; it's clarity. A quickly drawn square that contains a keyword is far more effective than a perfectly rendered but slow-to-create illustration. Speed and meaning are your top priorities.
Creating Hierarchy and Emphasis
Once you're comfortable with the basic components, the real magic begins when you start arranging them to guide the eye. This is called visual hierarchy—making it obvious what's most important at a glance. In old-school notes, you might indent a line or make text bold. With graphic notes, you have a much richer set of tools to play with.
Here’s how you can make key ideas pop:
- Size: Make the big ideas… well, big! The most important concepts should be physically larger than the supporting details.
- Color: Dedicate a specific color to highlight critical takeaways. Using a splash of red or orange for action items makes them impossible to miss when you review your notes later.
- Placement: Put the main theme right in the center of the page and let secondary ideas radiate outward. This immediately tells your brain where to focus.
This thoughtful use of space, size, and style is what turns a page of doodles into a structured, functional map of information. You’re essentially designing your notes to make the main points jump off the page.
How To Create Your First Visual Note
Staring at a blank page can be intimidating, but creating your first visual note is much simpler than it looks. The whole point isn't to create a masterpiece; it's to build a useful, personalized map of information that actually makes sense to you.
Whether you're going old-school with a notebook or using a digital app, the basic approach is the same. Let's walk through a simple, repeatable process that will get you started and build your confidence right away.
First, get your space ready. Grab a pen and some paper, or fire up your favorite note-taking app. You don’t need a whole rainbow of pens or a bunch of fancy tools just yet. A single, reliable pen is all it takes to begin.
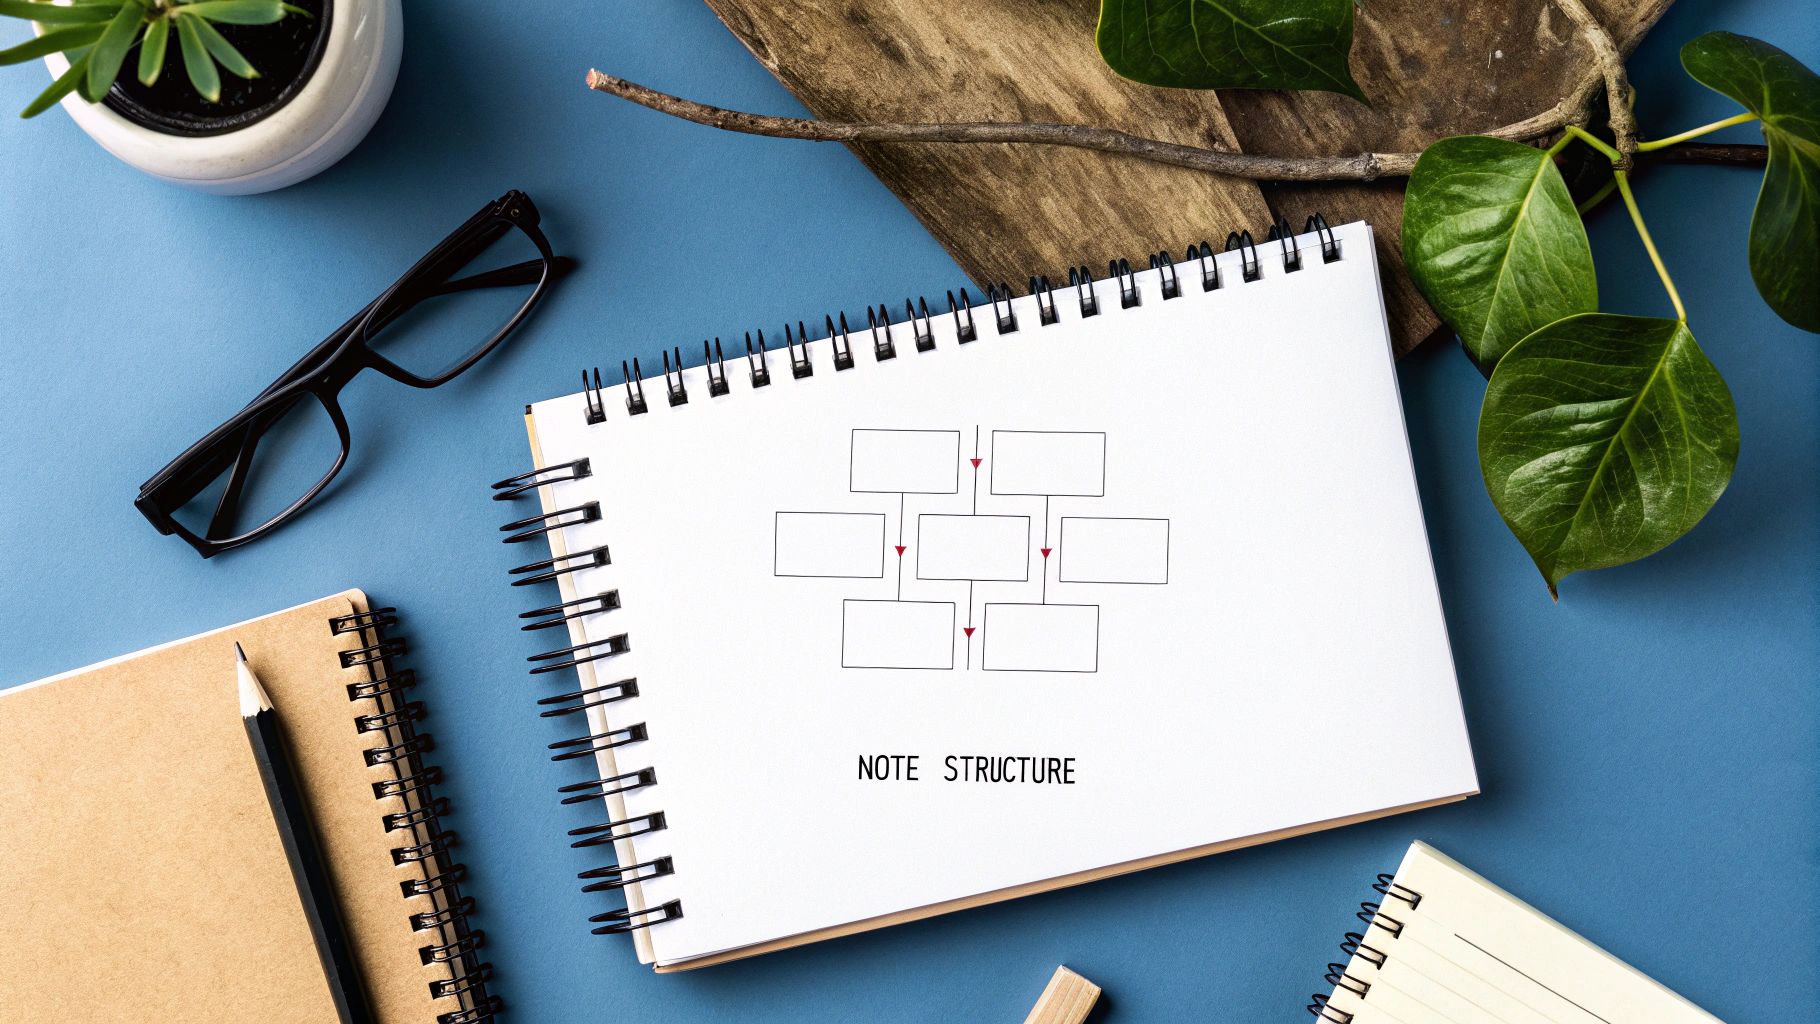
Now, figure out the main topic of the lecture, meeting, or chapter you’re about to dive into. Write that central theme right in the middle of your page and draw a circle or a box around it. This simple act creates an anchor for your note, giving your brain a focal point. From here, every other piece of information will radiate outward, creating a natural, organized structure.
Capturing Ideas As They Flow
Alright, here comes the active part. As you listen or read, your job is to be on the lookout for key ideas, important details, and any questions that pop up. But here’s the trick: instead of writing down full sentences, you’re going to capture these as short keywords or pithy phrases. This is a core habit in graphic note taking because it forces you to process the information, not just blindly copy it.
For each new key idea, draw a line branching out from your central topic. At the end of that line, jot down your keyword. Picture it like a spider web or a mind map growing from the center. So, if a speaker lists three benefits of a new strategy, you’ll draw three main branches from your core topic—one for each benefit.
From those main branches, you can then add smaller, secondary branches for supporting facts, examples, or stats. This automatically creates a visual hierarchy. The most critical concepts stay close to the center, while the finer details live on the outer edges.
One of the biggest fears people have is making a "mistake." In graphic note taking, there are no mistakes, only opportunities. If you write something in the "wrong" spot, just draw an arrow connecting it to where it really belongs. This flexibility is one of the method's greatest strengths.
Organizing Information Visually
As your note starts to fill up, you can use simple visual cues to add another layer of meaning and structure without slowing yourself down. Remember, clarity is always more important than artistic skill.
- Containers: Use basic shapes like boxes, circles, or clouds to group related points. If three different statistics all support the same key idea, draw a container around them to show they belong together.
- Simple Icons: You absolutely do not need to be an artist. A quick stick figure can stand for a person, a lightbulb can represent a new idea, and a question mark can flag something you need to look up later.
- Connectors: Use arrows to show relationships. A simple line connects two related ideas. A thick, bold arrow can show a cause-and-effect link. A dotted line is perfect for showing a weaker or more speculative connection.
By weaving these simple elements together, you stop being a passive listener and become an active participant. You're building a structured, memorable, and deeply personal document that captures your unique understanding of the topic.
Essential Tools For Every Visual Note Taker
Having the right tools can make all the difference in graphic note taking. It’s what separates a clumsy, frustrating effort from a fluid, creative flow. Whether you're a die-hard fan of pen and paper or you live on a digital canvas, your toolkit is what brings your visual notes to life.
Honestly, there's no single "best" tool out there. It all comes down to what feels right for you, your workflow, and the task at hand.
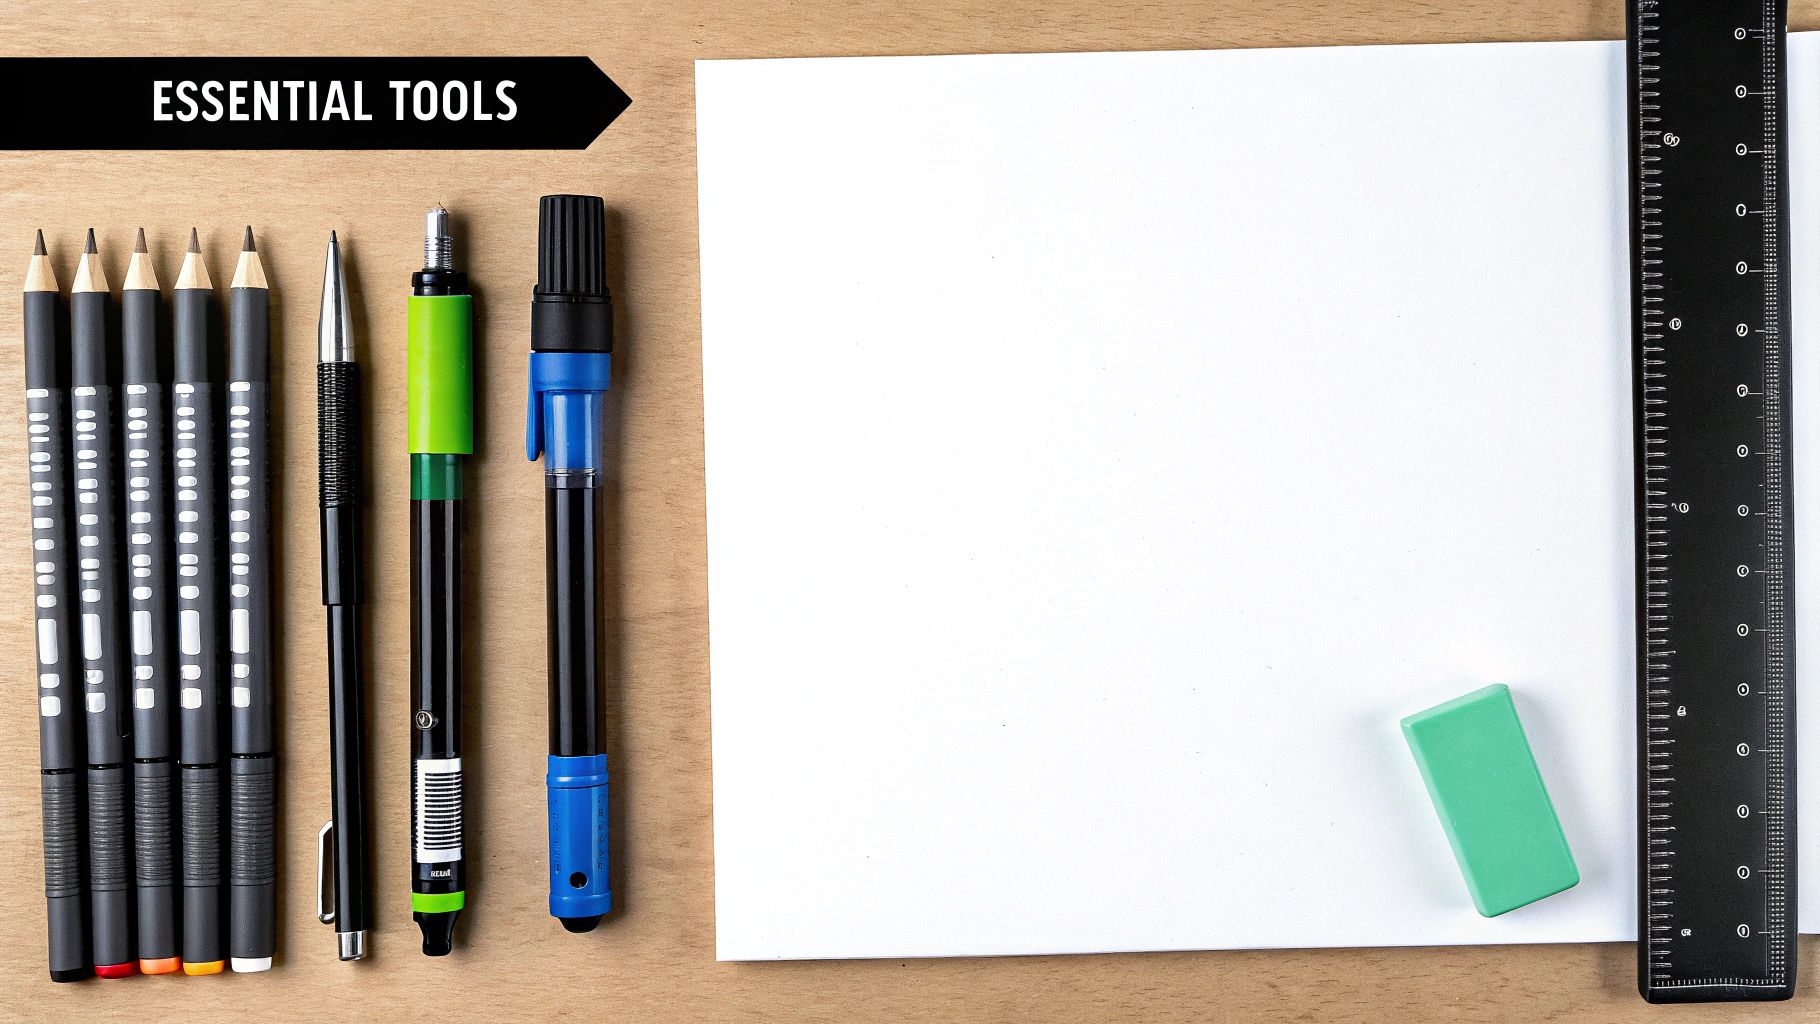
For many people, the best place to start is with the basics: analog. You can't really go wrong with the simple, tactile experience of a good pen on quality paper. Notebooks from brands like Rhodia or Leuchtturm1917 are popular for a reason—their paper holds up well and prevents ink from bleeding through.
Grab one of those, a few fine-tipped pens like the Sakura Pigma Microns, and maybe a handful of colored markers. That’s it. You have everything you need to start organizing ideas visually.
Choosing Your Digital Canvas
Then again, digital tools open up a whole world of possibilities that paper just can't match. Apps designed for tablets and styluses have become a game-changer for visual thinkers everywhere. The freedom to erase without a trace, resize an important sketch, or completely rearrange elements on the fly is a massive advantage. It's especially helpful when you're trying to keep up during a fast-paced meeting or lecture.
If you're ready to explore digital note-taking, here are a few features to look for:
- Infinite Canvas: Forget being boxed in by the edges of a page. An infinite canvas lets your ideas sprawl and connect in any direction they need to go.
- Layer Support: This is a lifesaver. By putting your drawings, text, and connectors on separate layers, you can tweak one part of your notes without messing everything else up.
- Custom Brushes: Being able to save your favorite pen styles, colors, and line weights means less time fiddling with settings and more time capturing ideas.
These digital features offer incredible freedom. If you're after a powerful tool that blends traditional note-taking with visual organization, you might want to check out our guide on the TNote editor. It’s built to help you turn simple markdown notes into clean, shareable visual cards.
The growing popularity of digital tools shows a clear shift toward visual communication. Timeline creation software, for instance, has become a staple in classrooms and boardrooms alike.
Tools like this let you map out complex information chronologically, a fundamental skill in graphic note taking. It's a perfect example of how the core principles of visual notes are merging with interactive tech to make information easier to understand and remember. You can discover more about these visual timeline tools and see how they might fit into your own note-taking process.
Graphic Note Taking Frequently Asked Questions
It’s completely normal to have a few questions—and maybe a little hesitation—when you first dive into graphic note taking. A lot of people wonder if they have what it takes or how these techniques could possibly fit into their busy lives. This FAQ is here to clear up those common worries.
Think of this as your go-to spot for quick, practical answers. We'll cover everything from getting over that "I can't draw" feeling to making visual notes work in a professional setting. Let’s get those questions answered.
Do I Need to Be an Artist to Do This?
This is the number one question I hear, and the answer is a simple, emphatic no. Graphic note taking isn't about creating art; it’s about communicating ideas clearly. It's less like painting a masterpiece and more like learning a new, visual alphabet made of simple shapes, lines, and words.
Your goal is to capture ideas, not to create a gallery-worthy drawing. A quick stick figure representing a customer or a simple box around a key concept is infinitely more useful than a detailed illustration that takes ten minutes to draw. You’re aiming for clarity and speed. Over time, you’ll develop your own library of go-to symbols that become a personal shorthand, and that’s where the real magic happens.
Remember, the value of a graphic note is in how well it organizes your thoughts and helps you recall information. If your "ugly" doodle helps you remember the most critical takeaway from a meeting, it's a huge success.
How Can I Keep Up in a Fast-Paced Lecture or Meeting?
Trying to draw while someone is talking a mile a minute can definitely feel intimidating. The trick is to stop thinking like a transcriber trying to get every word down. Your job isn't to be a court reporter; it's to be an information architect, capturing only the most important ideas.
Here are a few strategies I use to keep up with the pace:
- Listen for the Signposts: Presenters often give you clues like, "There are three main reasons for this," "The most important thing to remember is," or "To sum it all up..." These are your signals to grab a keyword and start a new visual branch.
- Keywords, Not Sentences: Force yourself to use single words or very short phrases. This frees up your brain to listen for the next big idea instead of getting stuck trying to write down every last detail.
- Prep Your Canvas: Before the meeting or lecture starts, just write the title or main topic right in the middle of the page. This one simple act gives you an anchor and helps you avoid that initial "blank page" paralysis.
- Use the "Park It" Method: If you miss something or don't have an icon in mind, just write the word and draw a box around it. You can always come back later to add a drawing if you need to. It keeps the flow going.
What Are the Best Use Cases for Graphic Note Taking?
The truth is, the applications for graphic note taking are almost endless. It’s a flexible skill that you can adapt to pretty much any situation where you need to understand, remember, or explain something complex, whether it's at work, at school, or in your personal life.
To give you a better idea, here’s a table that breaks down a few practical scenarios where visual notes can be a game-changer.
Graphic Note Taking Use Cases
| Context | Application | Primary Benefit |
|---|---|---|
| Business Meetings | Capturing action items, decisions, and strategic plans visually. | Creates a shared understanding among team members and makes follow-up clear and actionable. |
| Academic Lectures | Mapping out complex theories and showing relationships between concepts. | Dramatically improves information retention and makes studying for exams more effective. |
| Project Planning | Brainstorming ideas, outlining project phases, and mapping dependencies. | Helps identify potential roadblocks and clarifies the overall project scope for all stakeholders. |
| Personal Development | Journaling, goal setting, and summarizing key insights from books or podcasts. | Fosters deeper self-reflection and makes abstract goals more concrete and achievable. |
At the end of the day, if you ever find yourself lost in a complicated discussion or just wishing you could see the "big picture," that's the perfect time to grab a pen and start connecting the dots visually.
Ready to make your ideas more engaging and visually impactful? TNote is the easiest md2card tool, transforming your Markdown notes into beautiful, shareable cards with just one click. Perfect for students, educators, and creators who want to bring their content to life. Discover how you can elevate your notes at TNote.ai.