In today's dynamic educational environment, capturing and retaining student attention is the ultimate challenge. Traditional teaching methods can struggle to connect with diverse learning styles, making it difficult for complex information to resonate. This is where visual aids for teaching step in, transforming abstract concepts into tangible, memorable experiences. They are not just supplementary tools; they are essential instruments that boost comprehension, foster engagement, and make learning stick.
From the dynamic interactivity of a smartboard to the intricate connections of a mind map, visual aids bridge the gap between passive listening and active learning. They cater to learners who grasp information best when it's presented graphically, helping to clarify relationships between ideas and simplify dense subjects. Using these tools effectively can dramatically improve retention and participation across all grade levels.
This guide moves beyond theory to provide a practical roadmap. We will explore nine powerful types of visual aids for teaching, detailing actionable strategies, real-world classroom examples, and tool recommendations for each. You'll learn exactly how and why each visual aid works, equipping you to confidently integrate them and create more impactful, engaging lessons for every student in your classroom.
1. Interactive Whiteboards
Interactive Whiteboards (IWBs), such as those from SMART Technologies or Promethean, have revolutionized modern classrooms by transforming a simple display surface into a dynamic, touch-sensitive hub for learning. These large screens connect to a computer and projector, allowing both educators and students to directly manipulate digital content. This technology merges the familiar utility of a traditional whiteboard with the limitless potential of digital media, making it one of the most powerful visual aids for teaching available today.
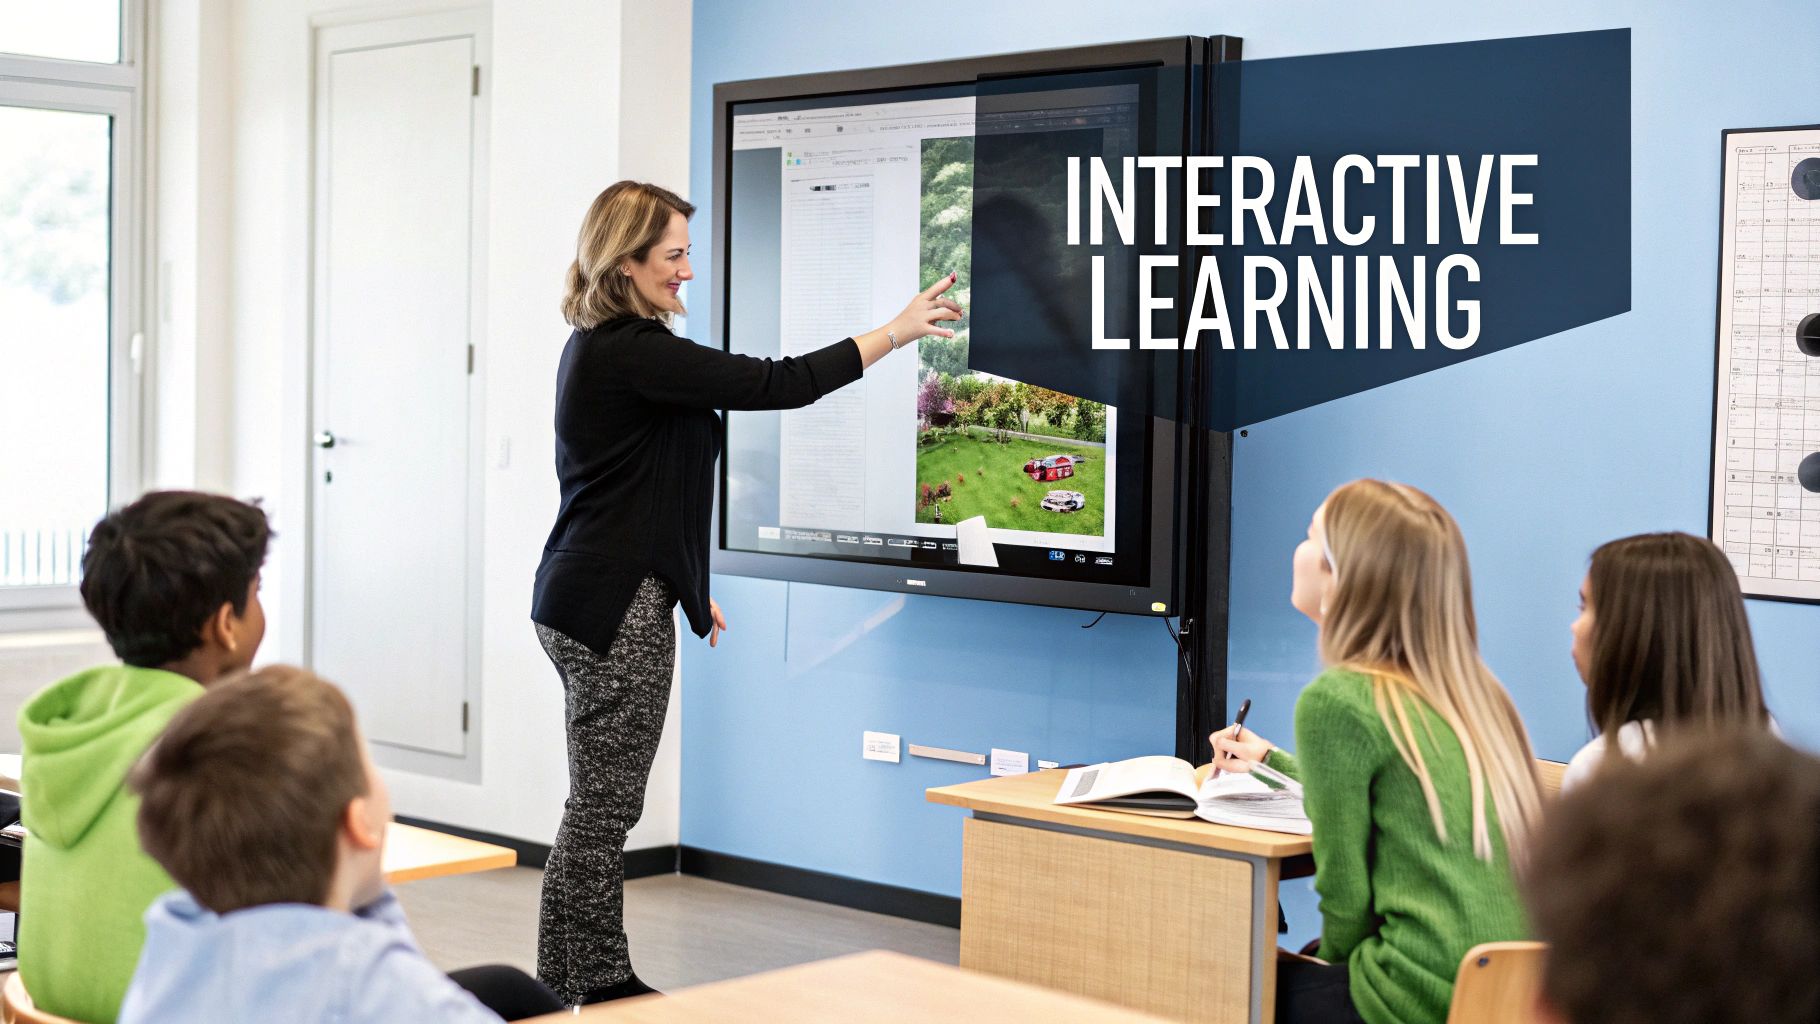
This direct interaction is what sets IWBs apart. Instead of passively watching a presentation, students can come to the board to solve a math problem, label parts of a cell in a biology diagram, or drag and drop words to form sentences in a language class. This hands-on approach caters to kinesthetic learners and boosts overall student engagement.
Practical Tips for Implementation
To maximize the impact of an IWB, integrate it thoughtfully into your lesson plans.
- Start Simple, Then Advance: Begin with basic functions like digital ink for annotation or using the board as a simple projector screen. Gradually introduce more complex features like interactive quizzes, multimedia embedding, and collaborative software as both you and your students gain confidence.
- Encourage Student Participation: Turn lessons into interactive experiences. Invite students to the board to solve problems, lead activities, or demonstrate their understanding. This shared ownership increases focus and makes learning more memorable.
- Utilize the Recording Feature: Many IWBs can record all on-screen activity, including audio narration. Use this to create review videos for absent students or a study guide that learners can access on their own time. It’s an excellent tool for reinforcing complex topics.
- Prepare an Analog Backup: Technology can be unpredictable. Always have a low-tech backup plan, like a traditional whiteboard or pre-printed handouts, ready in case of technical glitches to ensure your lesson continues smoothly.
2. Mind Maps and Concept Maps
Mind maps and concept maps are powerful visual diagrams that help students organize information, understand complex relationships, and think critically. A mind map typically radiates outward from a central topic, using branches to connect related ideas, while a concept map links various concepts hierarchically with connecting phrases to explain their relationships. Both methods transform abstract information into a concrete, spatial format, making them excellent visual aids for teaching complex systems or interconnected topics.
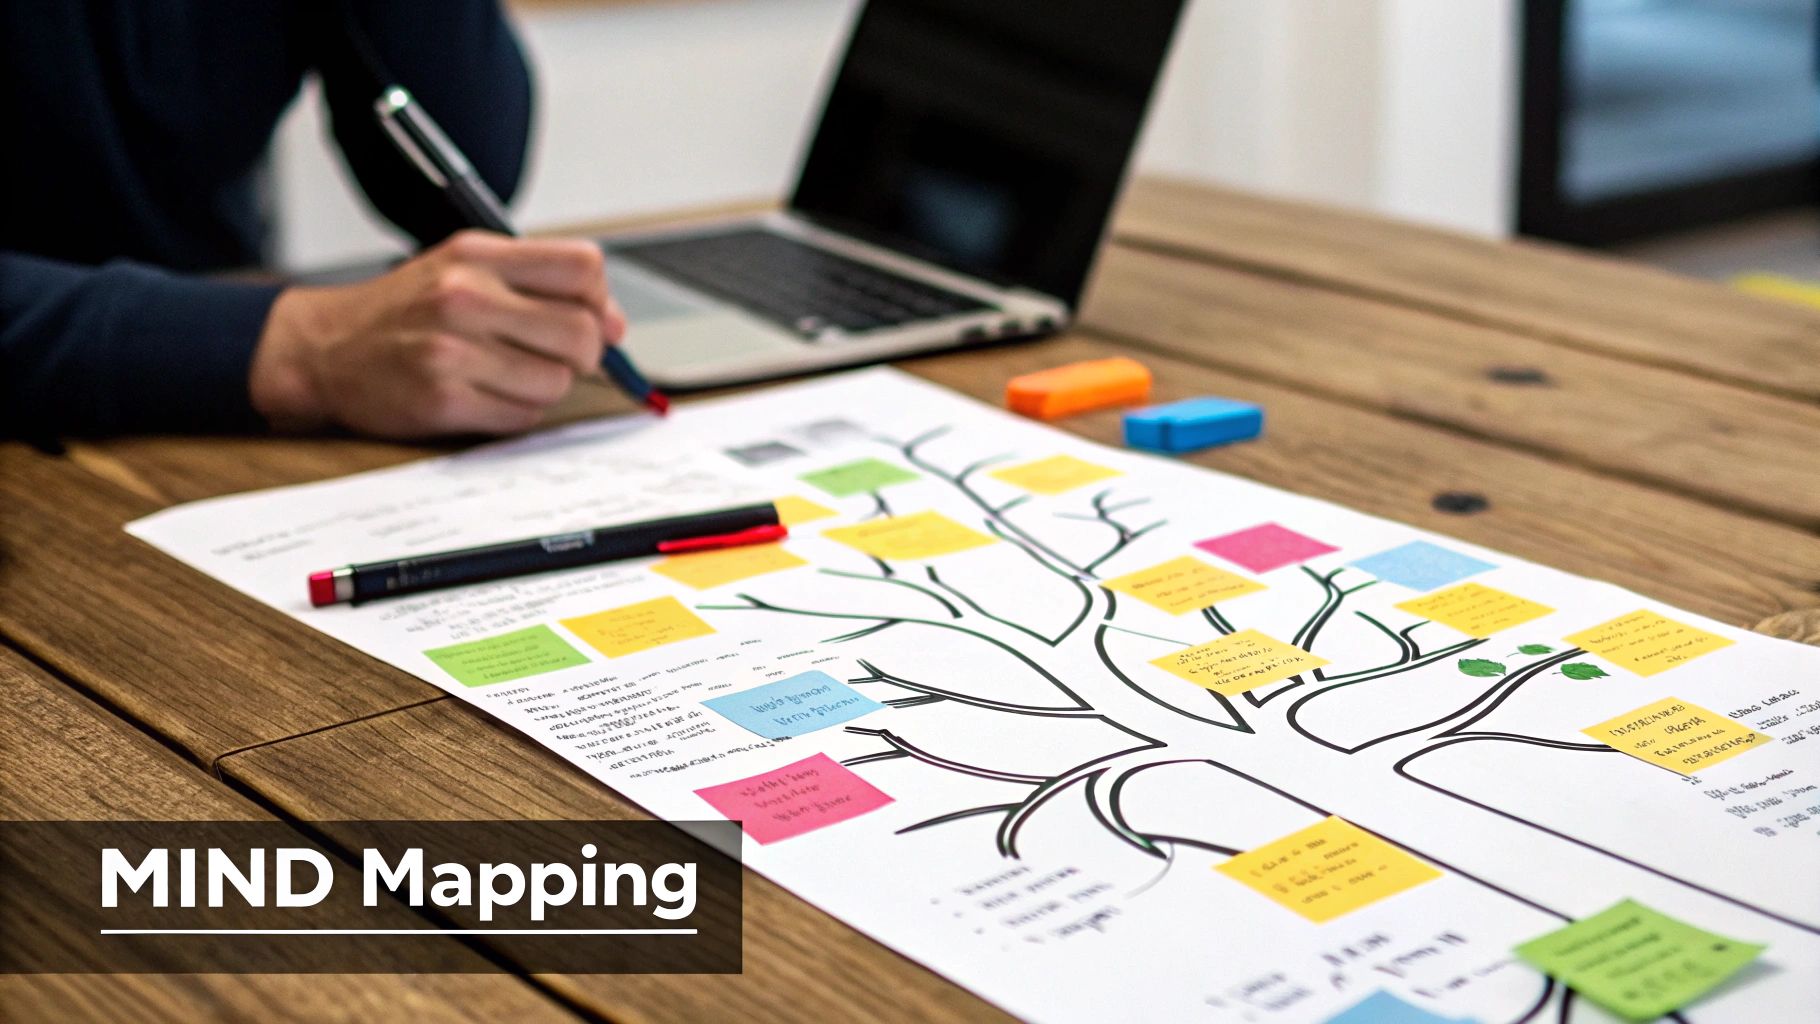
This visual structure helps learners see the "big picture" and the details simultaneously. For example, a biology teacher can use a concept map to illustrate the intricate relationships within an ecosystem, or a history class can create a mind map to trace the causes and effects of a major historical event. This process of building connections actively engages students, improving both comprehension and long-term retention of the material.
Practical Tips for Implementation
To get the most out of mapping, integrate it as a collaborative and creative tool.
- Start with a Clear Central Concept: Whether it's a historical figure, a scientific theory, or a literary theme, begin with a well-defined core idea. This provides a strong anchor for all subsequent branches and connections.
- Use Color and Symbols: Assign different colors to various branches or levels of the map to create clear visual categories. Incorporate simple icons or symbols to represent recurring ideas, which can make the map more engaging and easier to interpret at a glance.
- Keep Text Concise: Encourage the use of keywords and short phrases instead of full sentences. This forces students to distill information to its essence, which is a critical thinking skill in itself.
- Make it Collaborative: Create maps as a group activity on a whiteboard or using digital tools like Lucidchart or MindMeister. This fosters discussion, allows students to learn from each other’s perspectives, and builds a shared understanding of the topic.
3. Infographics
Infographics are powerful visual representations that combine text, images, charts, and design elements to present complex information in an easily digestible format. They excel at transforming dense data or multi-step processes into compelling, memorable visual narratives. Instead of reading a long text about the water cycle, students can follow its journey through a single, engaging image, making infographics one of the most effective visual aids for teaching complex topics quickly.
This blend of art and data helps students make connections and retain information more effectively. For example, a social studies teacher can use an infographic to display a historical timeline with key events, a health teacher can illustrate nutritional guidelines with clear icons and portions, or a math class can visualize statistical trends. Tools like Canva and Piktochart have made creating professional-looking infographics accessible to everyone, no design degree required.
Practical Tips for Implementation
To create impactful infographics, focus on clarity and visual storytelling.
- Focus on a Core Message: An effective infographic has a single, clear takeaway. Avoid cluttering it with too much information; instead, guide the viewer's eye through a logical flow that tells a story or explains a central concept.
- Maintain Visual Consistency: Use a consistent color scheme, font style, and set of icons throughout the design. This creates a cohesive and professional look that is easier for students to follow and understand.
- Ensure Data Accuracy and Readability: Always double-check your facts and cite your sources directly on the infographic if possible. Use high-contrast colors and legible fonts to ensure the content is accessible to all learners, including those with visual impairments.
- Balance Text and Visuals: The power of an infographic lies in its visual nature. Use icons, charts, and images to do the heavy lifting, and keep text concise. Short labels and brief explanations are more effective than long paragraphs.
4. Educational Videos and Animations
Educational videos and animations use the powerful combination of motion, sound, and narrative to explain complex concepts and demonstrate processes. From simple screen recordings to elaborate 3D animations, this dynamic content can serve as a primary teaching tool or a supplementary resource. Platforms like Khan Academy and TED-Ed have shown how effective these visual aids for teaching can be, transforming abstract ideas into concrete, memorable lessons.
This medium excels at showing change over time, visualizing microscopic processes, or breaking down multi-step procedures that are difficult to explain with static images alone. A well-crafted video can guide a student through a historical event, a complex math problem, or a scientific experiment. This makes learning more accessible and engaging, especially for visual and auditory learners who benefit from multi-sensory input.
Practical Tips for Implementation
To effectively integrate videos and animations, focus on purpose and quality.
- Keep it Concise and Focused: Aim for videos between 5-10 minutes to maintain student attention. State the learning objectives clearly at the beginning to set expectations and provide a clear focus for viewing.
- Prioritize High-Quality Production: Ensure both audio and visuals are clear and professional. Poor sound or blurry images can distract from the educational message and reduce the video's credibility and impact.
- Provide Scaffolding Materials: Don't just press play. Accompany videos with guided notes, discussion prompts, or a follow-up activity. This transforms passive viewing into an active learning experience and reinforces key concepts.
- Ensure Accessibility for All: Always include accurate, synchronized captions. This not only supports students who are deaf or hard of hearing but also benefits English language learners and helps all students with comprehension and information retention.
5. Physical Models and Manipulatives
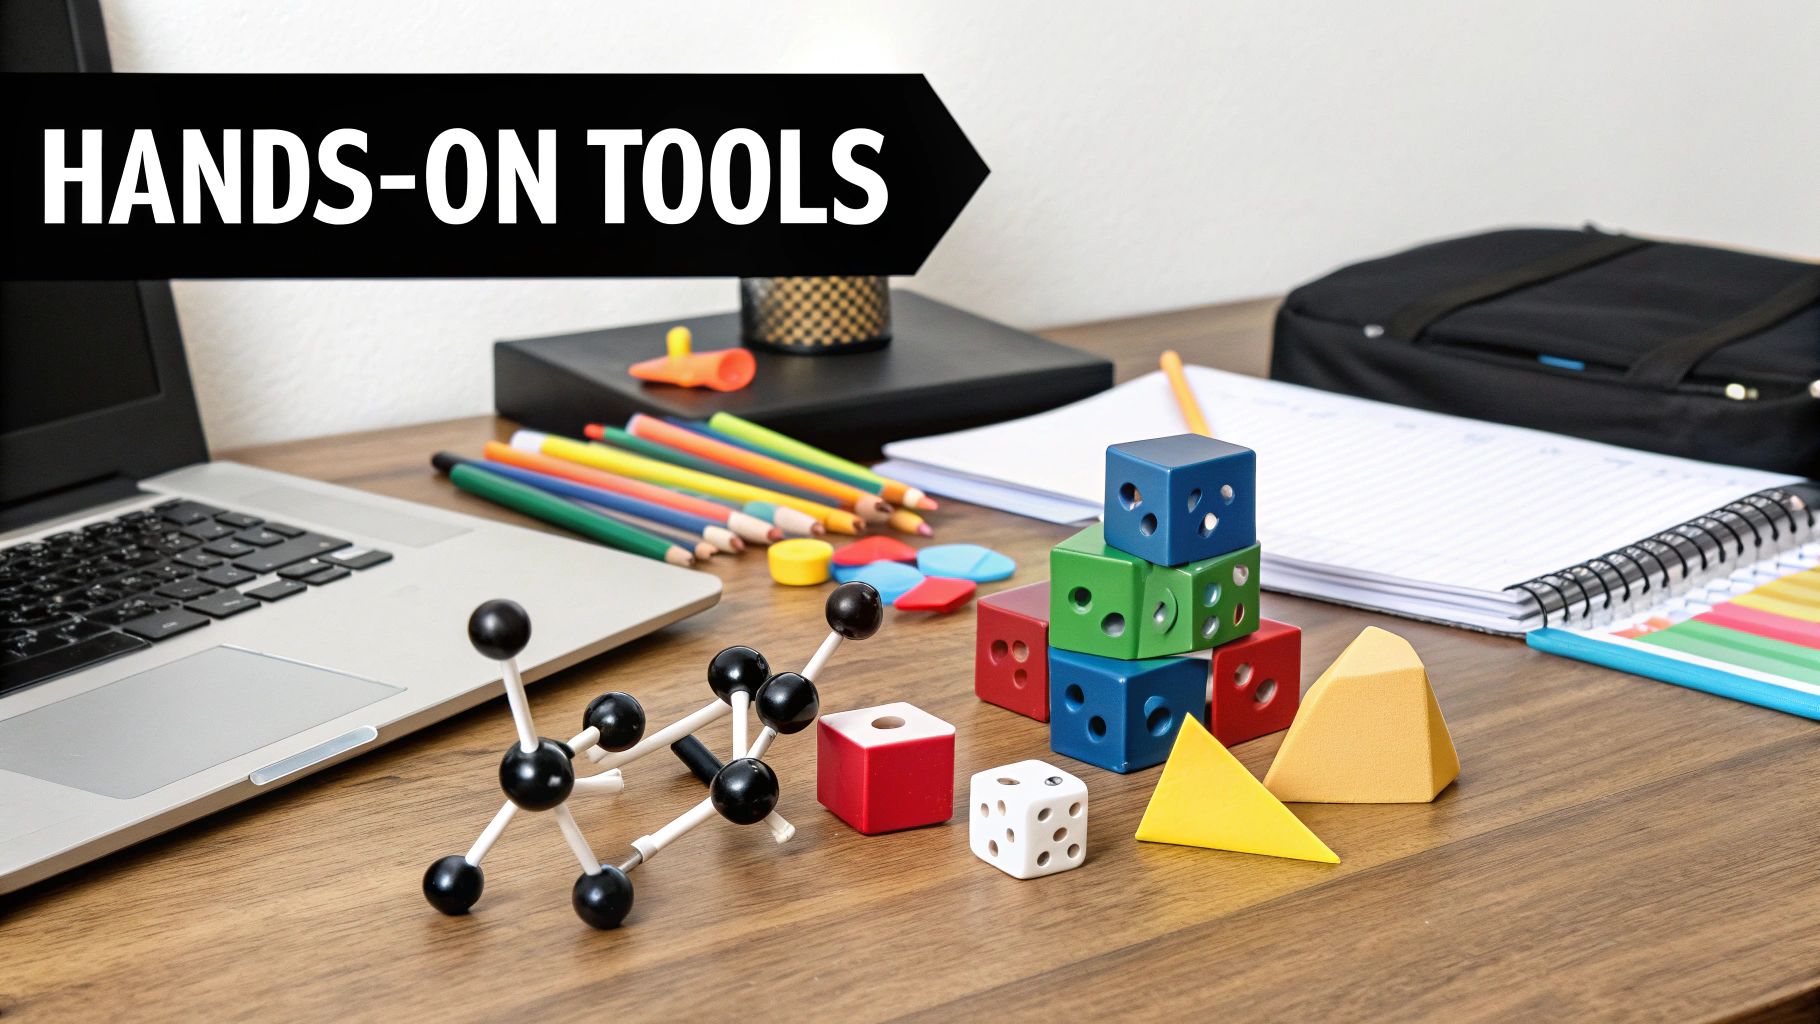
Physical models and manipulatives are three-dimensional, tangible objects that students can touch, move, and explore to understand complex or abstract ideas. These hands-on tools, ranging from geometric solids in a math class to a human skeleton model in anatomy, bridge the gap between abstract theory and concrete reality. Pioneered by educators like Maria Montessori, they are essential visual aids for teaching because they allow learners to build physical representations of concepts, fostering deeper, more intuitive understanding.
This tactile engagement is incredibly powerful. When a student uses algebra tiles to physically group terms and solve an equation or snaps together a molecular model kit to see a chemical bond, the concept becomes a memorable experience rather than just a rule to memorize. This method is especially effective for kinesthetic and visual learners, making abstract subjects like mathematics and chemistry more accessible.
Practical Tips for Implementation
To get the most out of these powerful tools, introduce and manage them with clear intention.
- Connect Concrete to Abstract: Always explicitly link the physical activity to the abstract concept it represents. After students build a structure with fraction bars, guide them to write the corresponding mathematical equation. This ensures the manipulation leads to conceptual understanding.
- Provide Time for Free Exploration: Before structured activities, give students a few minutes to simply explore the manipulatives. This satisfies their curiosity and helps them focus on the lesson's objectives when formal instruction begins.
- Establish Clear Ground Rules: Set clear expectations for how to handle, distribute, and store the materials. This minimizes classroom disruptions, prevents loss or damage, and ensures the focus remains on learning.
- Gradually Fade the Support: Use manipulatives as a scaffold. Once students grasp the concept using the physical objects, gradually transition them toward pictorial representations (drawings) and then to purely abstract symbols (numbers and equations).
6. Charts and Graphs
Charts and graphs are powerful tools that visually translate complex numerical data into digestible formats like bar charts, line graphs, and pie charts. Pioneered by figures like William Playfair and modernized by data visualization experts, they help students move beyond raw numbers to interpret data, identify patterns, and understand quantitative relationships. This makes them indispensable visual aids for teaching across numerous subjects, turning abstract information into concrete, analyzable insights.
The strength of charts lies in their ability to make comparisons and trends immediately obvious. In a science class, a line graph can clearly track experimental results over time, while a pie chart in a social studies lesson can instantly show population demographics. This visual clarity helps students grasp correlations and make data-driven conclusions far more effectively than they could from a table of numbers alone.
Practical Tips for Implementation
To use charts and graphs effectively, focus on clarity and interpretation.
- Choose the Right Chart for the Job: Match the chart type to your data's story. Use bar charts for comparing distinct categories, line graphs for tracking changes over time, and pie charts for showing parts of a whole. Misusing a chart type can confuse students.
- Label Everything Clearly: Ensure every chart has a descriptive title, clearly labeled axes (with units), and a legend if multiple data sets are present. Unlabeled charts are just abstract shapes and lose their educational value.
- Teach Data Interpretation: Don't just present a chart; teach students how to read it. Guide them to look at the title, axes, and scale first. Then, ask them to identify the key takeaways, trends, or outliers. The goal is to move from "what it shows" to "what it means."
- Start Simple and Build Complexity: Introduce basic, single-series bar charts before moving on to more complex scatter plots or stacked area graphs. This scaffolded approach builds students' data literacy skills without overwhelming them.
7. Slides and Presentations
Slides and presentations, powered by software like PowerPoint, Google Slides, or Keynote, are a foundational method for structuring and delivering information. They organize complex topics into a sequence of digestible segments, combining text, images, and multimedia to create a cohesive narrative. This format provides a visual anchor for lectures, ensuring that key points are clearly displayed and reinforced, making them a staple among visual aids for teaching for their reliability and clarity.
The primary strength of a slide deck is its ability to guide both the educator and the audience through a lesson systematically. Whether it's a university lecture detailing historical events, a student presenting a science project, or a corporate training session, presentations create a predictable flow. They serve as a visual script, preventing cognitive overload by presenting one core idea at a time.
Practical Tips for Implementation
To create compelling presentations that enhance rather than distract from your message, focus on clarity and engagement.
- Follow the 6x6 Rule: As a guideline, aim for no more than six bullet points per slide and six words per bullet point. This forces you to distill information to its essence, preventing text-heavy slides that overwhelm your audience.
- Prioritize High-Contrast Design: Ensure readability from every corner of the room by using high-contrast color schemes, such as dark text on a light background or vice versa. Use clear, legible fonts and ample white space to make content scannable.
- Use Visuals with Purpose: Images, charts, and videos should support or clarify your point, not just decorate the slide. A powerful image can convey emotion and context far more effectively than a block of text, making the content more memorable.
- Prepare for Technical Difficulties: Always have a backup plan. Save your presentation in multiple formats (e.g., PDF) and on different devices (cloud, USB drive). Having a printout or outline ready ensures you can deliver your lesson even if technology fails.
8. Virtual and Augmented Reality
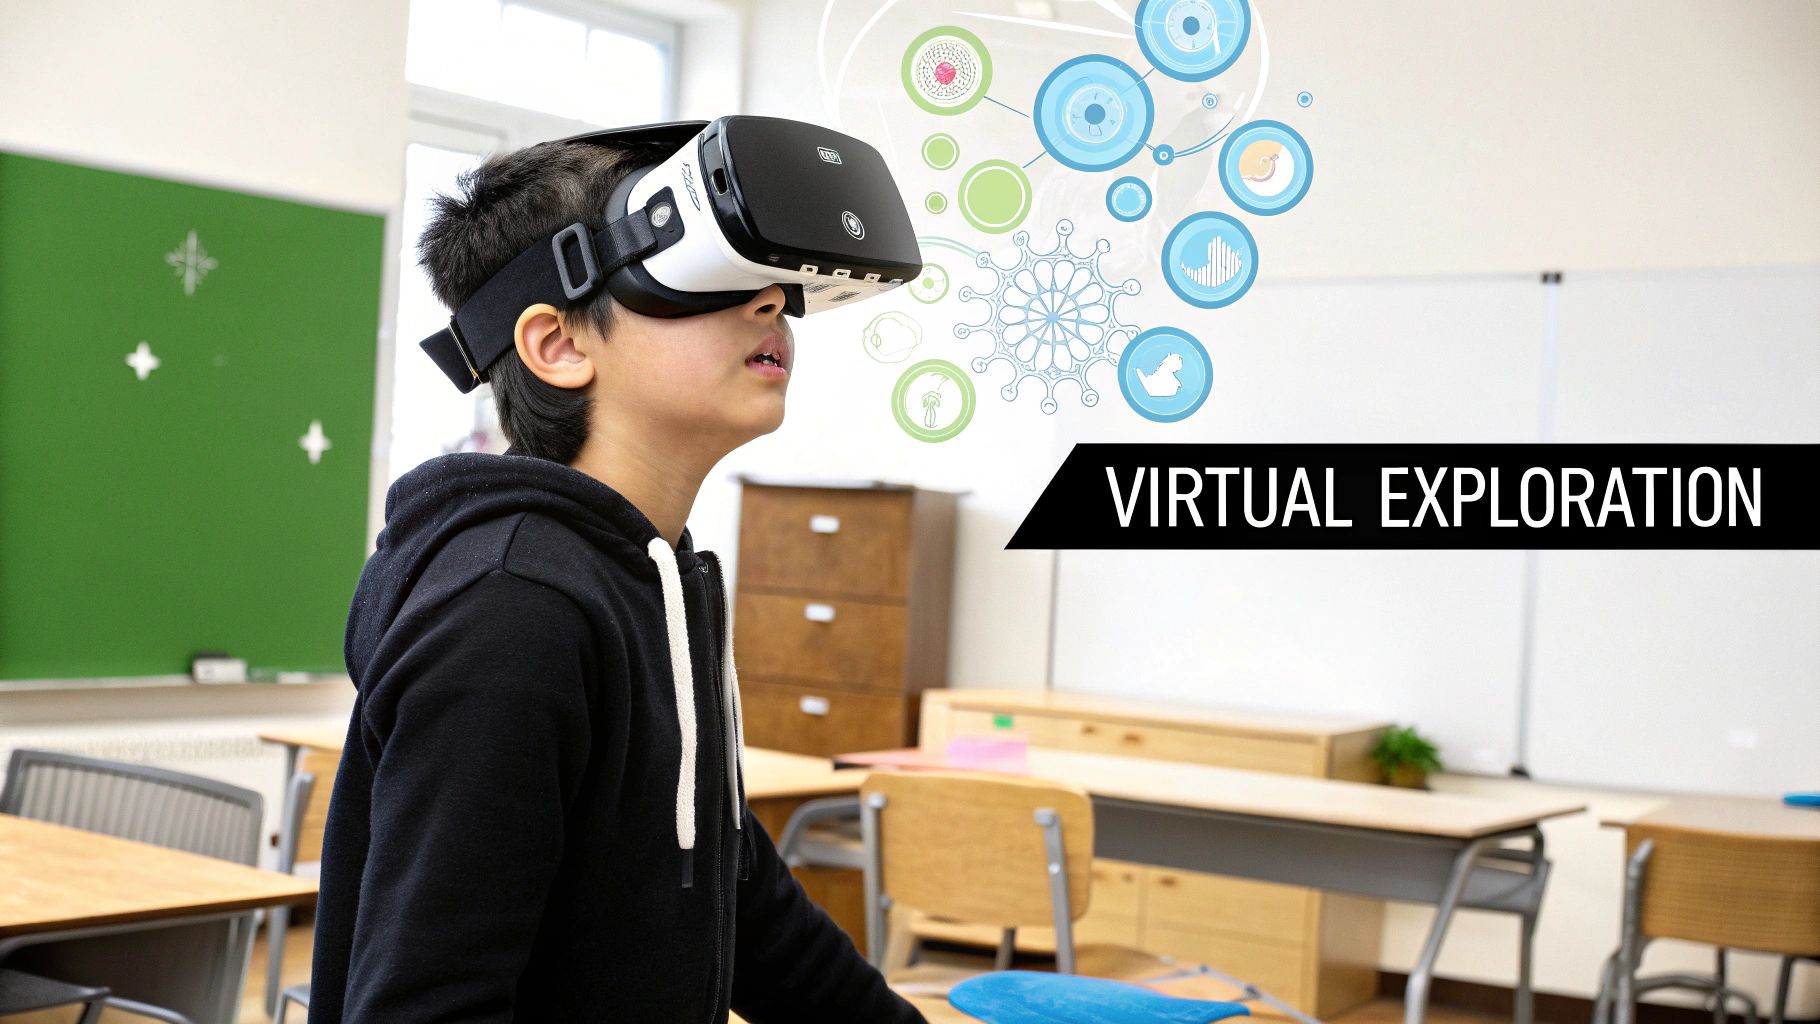
Virtual Reality (VR) and Augmented Reality (AR) are pushing the boundaries of classroom instruction by offering fully immersive or digitally enhanced experiences. VR transports users to entirely simulated environments, while AR overlays digital information onto the real world. These cutting-edge technologies provide experiential learning opportunities that would otherwise be impossible, dangerous, or prohibitively expensive, making them transformative visual aids for teaching.
The power of these tools lies in their ability to facilitate learning by doing. Imagine a history class walking through the streets of ancient Rome, medical students performing a delicate virtual surgery, or chemistry students manipulating complex molecular structures in 3D space. This level of immersion creates deep, contextual understanding and makes abstract concepts tangible and memorable.
Practical Tips for Implementation
To successfully integrate VR and AR, focus on structured and supportive implementation.
- Start with Short, Guided Sessions: Begin with brief experiences to help students acclimate and prevent sensory fatigue or discomfort. Guide them through the initial steps to ensure they understand the controls and objectives before letting them explore independently.
- Provide Clear Pre-Immersion Instructions: Before students put on a headset or use an AR app, clearly explain the learning goals, the task they need to complete, and how the technology works. This context ensures they remain focused on the educational objective.
- Blend with Traditional Methods: Use VR and AR to supplement, not replace, existing curriculum. Follow an immersive experience with a group discussion, a writing assignment, or a traditional lab to help students process what they saw and connect it to broader concepts.
- Prepare for Technical Hurdles: As with any advanced technology, be prepared for glitches. Ensure devices are fully charged, software is updated, and you have a basic troubleshooting plan or technical support contact ready to minimize disruptions.
9. Interactive Simulations and Games
Interactive simulations and games are dynamic digital learning environments that allow students to experiment with complex systems in a controlled, risk-free setting. These tools, from PhET's physics labs to stock market simulators, transform abstract concepts into tangible experiences. By allowing learners to manipulate variables and observe immediate cause-and-effect relationships, they serve as powerful visual aids for teaching that foster critical thinking and deep conceptual understanding.
The true value of these simulations lies in their ability to make the invisible visible. Students can see how atoms bond in a chemistry simulation, test economic theories in a virtual market, or navigate historical events by making key decisions. This gamified, inquiry-based approach makes learning more engaging and helps students build a robust mental model of the subject matter.
Practical Tips for Implementation
To harness the full educational potential of simulations, structure the activity carefully.
- Set Clear Learning Objectives: Before students begin, define what they should learn or discover. Provide guiding questions to focus their exploration, such as "What happens to the ecosystem if the predator population doubles?"
- Encourage Hypothesis Testing: Frame the activity as a scientific experiment. Ask students to form a hypothesis before changing variables and then record their observations to see if their prediction was accurate. This cultivates a scientific mindset.
- Facilitate a Debrief Session: After the simulation, lead a class discussion. Ask students to share their findings, discuss surprising outcomes, and connect the virtual experience to real-world principles and classroom curriculum.
- Supplement, Don’t Replace: Use simulations to introduce a complex topic, reinforce a difficult concept, or provide a safe space for experimentation. They are most effective when integrated with other teaching methods like lectures, labs, and readings, not as a complete replacement.
Visual Aids Comparison Matrix
| Item | Implementation Complexity 🔄 | Resource Requirements ⚡ | Expected Outcomes 📊 | Ideal Use Cases 💡 | Key Advantages ⭐ |
|---|---|---|---|---|---|
| Interactive Whiteboards | High – requires hardware setup and training | High – costly devices and maintenance | High engagement and collaboration | Collaborative lessons, multimedia integration | Enhances interactivity and saves lessons |
| Mind Maps and Concept Maps | Low to Medium – simple tools or software | Low – paper or digital apps | Improved memory and conceptual clarity | Brainstorming, planning, hierarchical learning | Supports creativity and big-picture thinking |
| Infographics | Medium – needs design skills/software | Medium – design tools and time | Clear, memorable data presentation | Explaining complex data or processes | Makes data accessible and shareable |
| Educational Videos and Animations | High – production and technical skills | High – recording equipment and software | Engaging, multi-sensory learning | Instructional content, demonstrations | Combines visuals and audio for lasting impact |
| Physical Models and Manipulatives | Medium – acquiring/managing materials | Medium to High – physical objects | Concrete understanding and active learning | Abstract concepts made tangible | Engages kinesthetic learners, fosters exploration |
| Charts and Graphs | Low – chart creation tools widely available | Low – software or manual drawing | Better data interpretation and analysis | Data-driven subjects and experiments | Reveals patterns and supports analytic skills |
| Slides and Presentations | Low to Medium – relies on software templates | Low – presentation software | Structured lessons with multimedia | Lectures, workshops, project presentations | Easy to update, supports lesson pacing |
| Virtual and Augmented Reality | High – advanced tech and content creation | High – VR/AR devices and software | Immersive, experiential learning | Simulations of dangerous/impossible scenarios | Highly engaging, supports spatial learning |
| Interactive Simulations and Games | Medium to High – software development or access | Medium – devices and software | Active learning with immediate feedback | Experimentation, hypothesis testing, inquiry | Promotes engagement and safe experimentation |
Putting It All Together: Creating Your Visual Teaching Toolkit
We’ve explored a diverse landscape of powerful visual aids for teaching, from the dynamic interactivity of smartboards to the tactile learning offered by physical models. The journey from traditional chalk-and-talk to a visually rich classroom is not about mastering every single tool overnight. Instead, it’s about strategic curation and thoughtful implementation. The most effective educators build a customized toolkit, selecting visual aids that align with their specific learning objectives, subject matter, and, most importantly, the unique needs of their students.
The core principle connecting all these aids, from infographics and concept maps to VR simulations, is their ability to transform abstract information into concrete, digestible, and memorable experiences. By presenting concepts in multiple formats, you cater to diverse learning styles and create more pathways to understanding. This approach moves beyond simple information delivery and fosters an environment of active engagement and critical thinking.
From Theory to Practice: Your Actionable Next Steps
Building your visual teaching arsenal should be an incremental process. Overhauling your entire curriculum at once is a recipe for burnout. A more sustainable and effective strategy involves a few key steps:
- Start Small and Scale: Choose just one or two visual aids from this list that genuinely excite you and seem like a natural fit for an upcoming lesson. Perhaps you can start by converting a text-heavy lecture into a more compelling slide presentation with better visuals or by creating a simple mind map to kick off a brainstorming session.
- Align Aid to Objective: Before selecting a tool, ask yourself: what is the primary goal of this lesson? If it's to show relationships between concepts, a mind map is ideal. If it's to explain a complex process, an animation or video might be the best choice. If it's to explore data, charts and graphs are your go-to.
- Gather Student Feedback: Don’t be afraid to ask your students what works. After using a new visual aid, conduct a quick poll or a simple "one-minute paper" asking what they found helpful and what could be improved. Their insights are invaluable for refining your approach.
The Lasting Impact of Visual Learning
Ultimately, integrating effective visual aids for teaching is about more than just making lessons look good. It is a fundamental shift toward creating more inclusive, engaging, and impactful learning environments. When students can see, manipulate, and interact with the concepts they are learning, they build deeper, more lasting neural connections. This fosters not just rote memorization but true comprehension and the ability to apply knowledge in new contexts. Your commitment to building a robust visual toolkit is an investment in your students' curiosity, confidence, and long-term academic success.
Ready to start creating your own simple, powerful visual aids in seconds? With TNote, you can instantly transform your lesson notes, study guides, or key takeaways into clean, shareable visual cards using simple Markdown. Try TNote today and discover the fastest way to turn your text into engaging educational content.